How a support team cut first response time
A before-and-after method talk made from a team retrospective: the old ticket path as an editable diagram, the four-step method, one urgent ticket walked through, what didn't work, results as a table plus native bar and line charts, five lessons and a closing exercise. Drawn with shapes only, no pictures. Fictional company and data.
A support team's retrospective in Markdown, with before-and-after figures and twelve weeks of medians per period. Fictional company and figures.
With these instructionsA talk at Fieldnote's internal Operations Guild on 3 December 2026 by Lena Park, Head of Support, sharing how the support team cut first-response time. Write in Lena's voice, as a method other teams can copy. Tell it as a before-and-after story: why we did it, how a ticket moved before (an editable flow diagram), the method Sort, Route, Swarm, Learn plus follow-the-sun (an editable diagram), what didn't work, the results (a native, editable before/after comparison and a line chart of the weekly median first response), the five lessons, and what's next. All names and figures are fictional: label data slides Illustrative data, with source lines 'Source: Fieldnote support desk reports, April–October 2026 (illustrative)'. Speaker notes should be Lena's talk track, with one concrete ticket example where it helps.
Free to download, no sign-in needed. Open it in PowerPoint and change anything.

- Look
- Ink Notes
- Deck type
- Workshop Teaching
- Images
- No images
- Slides
- 11
- Deck language
- English
Every slide, unedited
Click a slide to see it large.
-
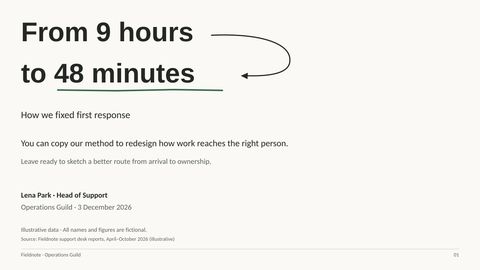
1From 9 hours to 48 minutes
Speaker notes
Welcome, everyone—I’m Lena Park, Head of Support. I want to walk you through how we cut the wait for a first reply without adding people, by changing how a request found the right owner. This is an illustrative story—all names and figures are fictional—but the method is something you can use to examine a workflow in your own team. By the end, I’d like you to be able to sketch a better route from a request arriving to someone taking responsibility for it.
-
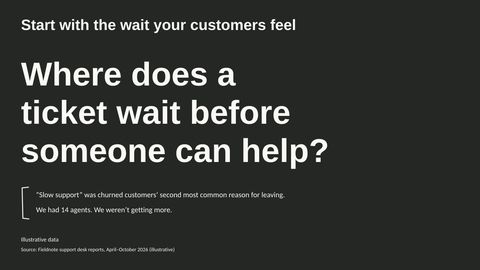
2Start with the wait your customers feel
Speaker notes
That route matters because the wait is what customers experience, regardless of how busy we are behind the scenes. Slow support was the second most common reason churned customers gave for leaving, and with 14 agents and no additional headcount, our question became where we could remove waiting—not how we could close more tickets.
-
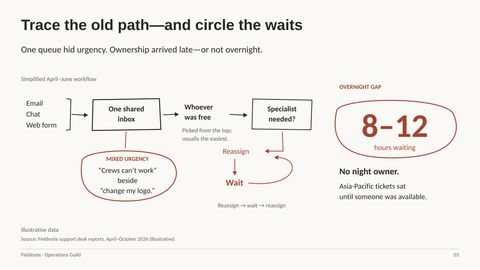
3Trace the old path—and circle the waits
Speaker notes
To answer that, we traced what actually happened after a customer contacted us. Email, chat and web forms all fed the same inbox, where whoever was free tended to pick an easy ticket rather than the one with the greatest customer impact. Specialist needs emerged after that first pickup, so a ticket could pass from person to person, averaging 2.3 reassignments. Meanwhile, Asia-Pacific requests could sit for 8 to 12 hours because nobody owned the night. The problem wasn’t just time spent doing the work; it was time spent waiting for the right person to start.
-
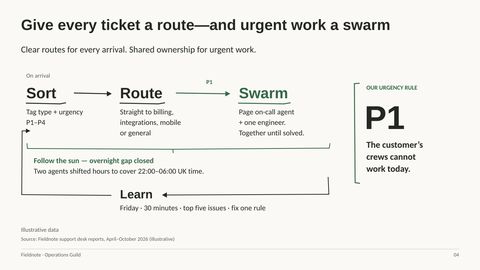
4Give every ticket a route—and urgent work a swarm
Speaker notes
Those waits gave us the requirements for a different route. We used a short form and keyword rules to identify type and urgency on arrival, then sent each type directly to the relevant skills group instead of leaving it for someone to pick. When crews couldn’t work that day, we paged an on-call agent and an engineer together, so urgent work had a different response path rather than just a better position in the queue. Two agents shifted their hours to cover 22:00 to 06:00 UK time, closing the overnight ownership gap without increasing headcount. We also made the route adjustable: every Friday, we spent 30 minutes reviewing the five most common issues, creating guidance and fixing one rule.
-
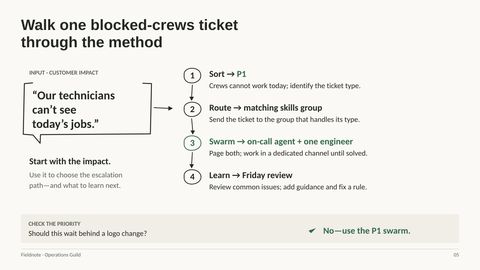
5Walk one blocked-crews ticket through the method
Speaker notes
Let’s make that route concrete with a customer saying, “Our technicians can’t see today’s jobs.” The impact makes this P1 because the crews cannot work today; we still identify the ticket type so it reaches the matching skills group rather than guessing at the cause. We then page the on-call agent and one engineer, who work together in a dedicated channel until it is solved. At the Friday review, we look at common issues for guidance we should add and a routing rule we should improve. That is why this request should not wait behind a logo change: the customer’s ability to work determines the escalation path.
-
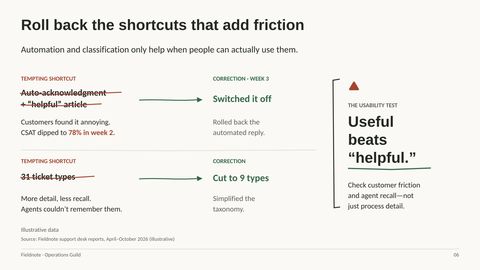
6Roll back the shortcuts that add friction
Speaker notes
Having a clear method didn’t mean every part of our first implementation was useful. We tried automatic acknowledgments with a supposedly helpful article, but customers found them annoying, and satisfaction dipped to 78% in the second week of the change. We switched those replies off in week three. We also started with 31 ticket types, discovered that agents couldn’t remember them, and cut the list to nine. The lesson was to test whether people could actually use the process, not whether we had described every possible case.
-
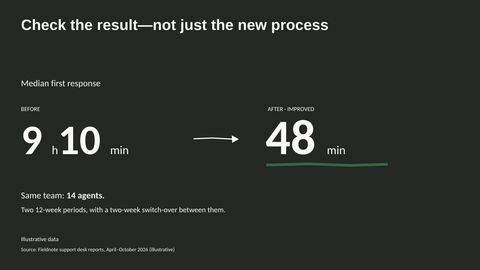
7Check the result—not just the new process
Speaker notes
After those corrections, we checked whether the redesigned workflow had changed the customer’s wait. Across two 12-week periods separated by a two-week switch-over, median first response fell from 9 hours 10 minutes to 48 minutes, with the same 14 agents.
-
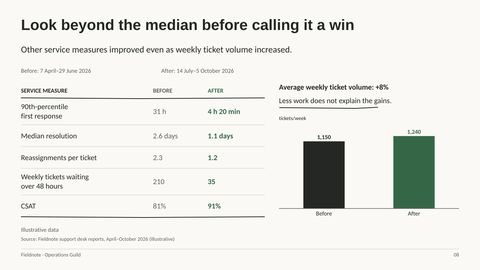
8Look beyond the median before calling it a win
Speaker notes
That median was encouraging, but we needed to know whether longer waits and the rest of the service had improved too. The 90th-percentile first response fell from 31 hours to 4 hours 20 minutes, while the average number of tickets waiting more than 48 hours dropped from 210 to 35 per week. Resolution time and reassignments also fell, and satisfaction rose from 81% to 91%. Crucially, average weekly arrivals increased from 1,150 to 1,240—about 8%—so a lighter workload does not explain the gains. Taken together, these measures point to an improvement beyond simply getting an initial reply out faster.
-
9Read the weekly pattern, not just the endpoints
Speaker notes
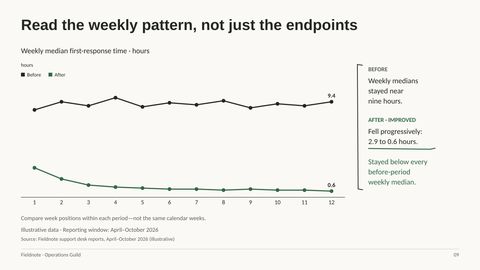
Those overall comparisons still leave a question: was the improvement sustained across the period? Before the change, weekly medians stayed close to nine hours; afterward, they moved from 2.9 hours in the first week to 0.6 hours in the last, with small fluctuations along the way. Every after-period weekly median was below every before-period weekly median, so this wasn’t just one unusually good week pulling down the result. We’re comparing positions within two separate 12-week periods here, not matching calendar weeks, and these weekly medians are distinct from the overall 48-minute median.
-
10Copy these five lessons—not our exact setup
Speaker notes
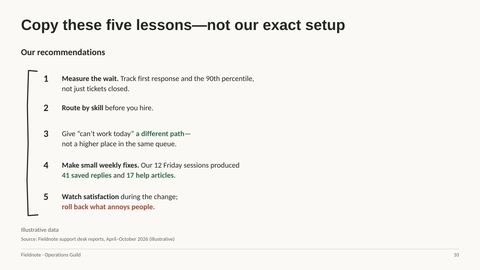
That sustained pattern is why I’d recommend copying the principles rather than our exact staffing hours or ticket categories. Start by measuring customer waiting, including the long-wait end of the distribution, and establish skilled ownership before assuming you need more people. Give work-stopping requests a separate escalation path instead of relying on queue position alone. Keep the improvements small and regular: our 12 Friday sessions produced 41 saved replies and 17 help articles. And keep watching satisfaction during the transition, because a process that looks efficient can still add friction for customers.
-
11Sketch your next route—and name one change
Speaker notes
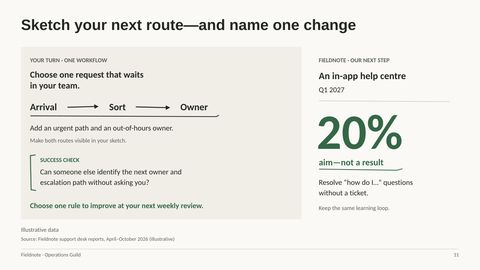
To put those principles to work, choose one request that waits in your team and sketch how it arrives, gets sorted and finds an owner. Add the urgent route and the out-of-hours owner, then ask whether someone else could identify the next owner and escalation path without asking you. Choose one rule to improve at your next weekly review rather than waiting for a complete redesign. Our next step is an in-app help center in Q1 2027, aiming to resolve 20% of “how do I” questions without a ticket—that is a target, not a result. The takeaway I’d leave you with is to make ownership clear, make waiting visible and keep learning from the work that comes through.


What you can change in the file
Every word is real text
Titles, bullets and labels are text boxes. Retype them, restyle them or translate them.
Diagrams are shapes
Boxes, arrows and icons are PowerPoint shapes you can move, resize and recolour.
Pictures stay separate
Photos and illustrations are their own images, so you can swap or crop them.
Charts are real charts
Each chart keeps its numbers in its own Excel sheet. Choose Edit Data, type new figures and the chart redraws.
 How to make slides or a PowerPoint automatically
 Quarterly business review: performance, drivers and decisions
 Luxury hospitality: a flagship hotel investment proposal
Make your next deck in minutes, then make it yours.
Start with 20 free credits. No card needed.
Start free