AI-made slides with charts you can actually edit
A picture of a chart is a dead end the first time a number changes. Every chart PPTNative makes is a native PowerPoint chart, with its data in its own sheet.
How it works
Bring your numbers
From a table in your document, an Excel workbook or a CSV file.
Get native charts
Column, bar, line, pie and other common charts, styled to the deck's look.
Change and redraw
Chart Design › Edit Data opens the sheet. Type a new value and the bars and labels update.
Charts that stay useful
Real PowerPoint charts
Change type, colours or labels with PowerPoint's own tools, as with any chart you made yourself.
Numbers from your source
Values come from your document or data; missing values are left out, never made up.
Labels you can read
Short category labels, values on the bars, and targets or ranges written beside the chart.
Tables stay tables
Comparisons that read better as a table become native PowerPoint tables.
Decks made this way
Made by PPTNative and shown unedited, unless marked as finished by hand. Open one to see every slide or download the .pptx.
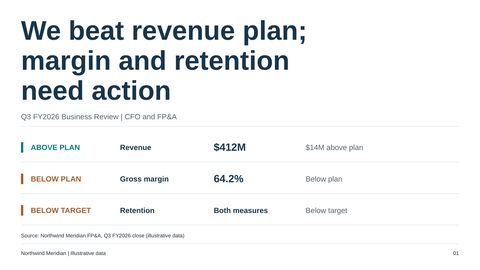 Quarterly business review: performance, drivers and decisions
 Family office: annual portfolio review and risk analysis
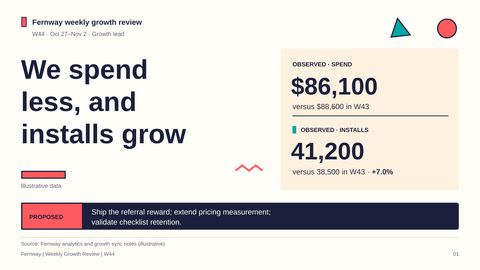 Weekly growth review: funnel, experiments and next actions
Questions
How can I check that a chart is editable?
Click the chart in PowerPoint. If Chart Design appears and Edit Data opens a sheet, it is a real chart. The quarterly business review example shows this step by step.
Can I change the chart type?
Yes. Change Chart Type works as it does on any PowerPoint chart.
Does every slide get a chart?
No. Charts are planned where the numbers tell the story; the rest are text, diagrams, tables or pictures.
Make your next deck in minutes, then make it yours.
Start with 20 free credits. No card needed.
Start free