Weekly report slides from your numbers and notes
Product, growth, engineering and research teams present every week. Give PPTNative this week's workbook and notes: it writes the week-over-week story, the blockers and the next steps, in a design that stays the same from week to week.
How it works
Add this week's files
Metrics in Excel or CSV, notes in Markdown or Word. Add last week's deck too, so the story carries on.
Keep last week's look
Choose last week's deck as your style: its colours, fonts and title placement carry over.
Present
Review the outline, download the .pptx and change anything before the meeting.
What a weekly deck needs
Week over week, worked out
Changes, targets and owners come from your data, with ups and downs coloured by meaning.
Observed apart from proposed
Results, hypotheses and proposals are labelled apart, so the meeting argues about the right thing.
The same design every week
Week 2 keeps Week 1's layout and look; only the numbers and conclusions change.
Charts that update
Every chart is a native PowerPoint chart, so a late number is a quick Edit Data away.
Decks made this way
Made by PPTNative and shown unedited, unless marked as finished by hand. Open one to see every slide or download the .pptx.
 Internet product weekly: key metrics, project progress and next week's priorities
Soft Rounded · 11 slides · 中文 (简体)
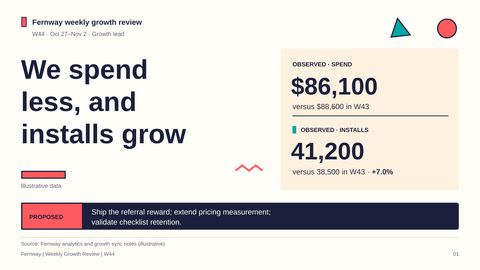 Weekly growth review: funnel, experiments and next actions
Memphis · 12 slides · English
 Engineering weekly: delivery, quality metrics and risks
Dark Tech · 11 slides · 中文 (简体)
 Research group meeting: weekly progress, results and next steps
Sketch Notes · 11 slides · 中文 (简体)
Questions
Can I update last week's deck instead of starting over?
Yes. Add last week's deck and this week's files together, and choose last week's deck as your style. Several sources in one deck use Fusion, a paid feature. The examples show Week 1 and Week 2 side by side.
Can it read my metrics export?
Yes: Excel (.xlsx) and CSV files, including CSV exported from Chinese systems.
How long does it take?
About a minute for the outline and a few minutes to draw the deck.
Make your next deck in minutes, then make it yours.
Start with 20 free credits. No card needed.
Start free