Quarterly business review: performance, drivers and decisions
A 14-slide executive QBR for a fictional software company, with seven native PowerPoint charts: revenue against plan, the margin bridge, regions, retention against target, churn reasons and the Q4 outlook. Next quarter, open Edit Data, type the new figures and every chart redraws. Illustrative data.
A two-page fictional brief (Markdown) from the company's FP&A team: revenue and plan by quarter and region, the margin drivers, retention with targets, churn reasons, the Q4 forecast, last quarter's commitments, priorities with owners and the decisions requested. Drawn in the collection's house look, learned from the group AI investment plan deck.
With these instructionsThe company's own quarterly business review, presented by the CFO and FP&A team to the executive leadership team: write in the presenters' voice, stating results, causes and asks with confidence, not as an outside reviewer questioning the brief. Cover revenue versus plan, last quarter's commitments, margin drivers, regional performance, customer retention, the Q4 outlook and next-quarter priorities with owners, ending with the decisions requested. Show every series of numbers as a native, editable chart (revenue versus plan, regional actual versus plan, the margin bridge, the retention trend against target), so the team can update the deck with new data each quarter. All figures are fictional: label them Illustrative data, and write source lines as 'Source: Northwind Meridian FP&A, Q3 FY2026 close (illustrative data)', never 'the brief'. Speaker notes should interpret each chart and give the talking points.
Free to download, no sign-in needed. Open it in PowerPoint and change anything.

- Look
- Swiss Minimalchosen automatically
- Deck type
- Operating Review
- Images
- No images
- Slides
- 14
- Deck language
- English
Every slide, unedited
Click a slide to see it large.
-
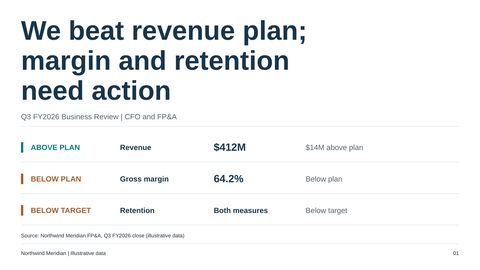
1We beat revenue plan; margin and retention need action
Speaker notes
Today, we’ll review a quarter in which revenue exceeded plan, but the underlying operating performance was less strong. We finished at $412 million in revenue, while gross margin and both retention measures fell below expectations. Our focus is on what drove that divergence, what it means for Q4, and the targeted decisions we need from this team.
-
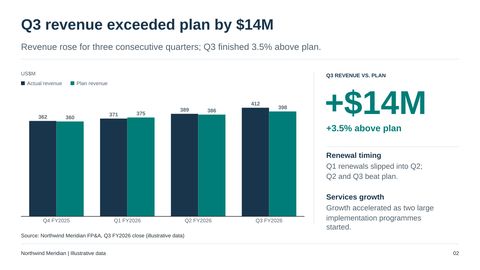
2Q3 revenue exceeded plan by $14M
Speaker notes
Starting with the revenue strength, Q3 finished $14 million above the $398 million plan, a 3.5% beat. Revenue has increased for three consecutive quarters, although renewal timing affected performance against plan: enterprise renewals that slipped out of Q1 helped Q2. Services also accelerated as two large implementation programs started, increasing their share of revenue from 21% in Q2 to 23% in Q3. That mix shift matters as we turn from growth to profitability.
-
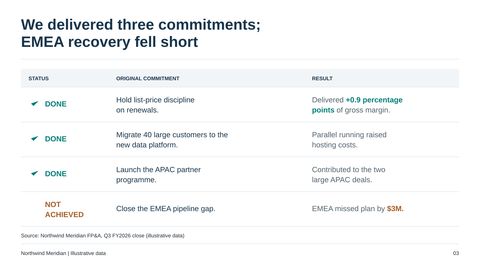
3We delivered three commitments; EMEA recovery fell short
Speaker notes
Behind that revenue result, we delivered three of the four commitments made at the Q2 review, but completion did not always translate into immediate operating improvement. Renewal pricing discipline added 0.9 percentage points to gross margin, and the APAC partner launch contributed to the two large deals there. We also migrated all 40 large customers, but running the old and new environments in parallel raised hosting costs. The unresolved commitment was EMEA pipeline recovery, where revenue still missed plan by $3 million.
-
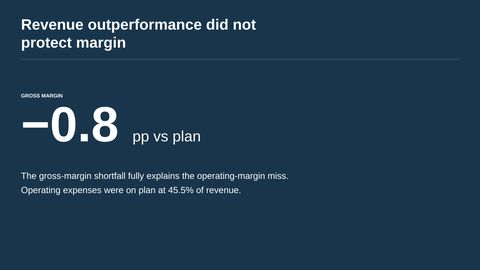
4Revenue outperformance did not protect margin
Speaker notes
Those execution outcomes help explain why the revenue beat did not carry through to operating margin. Operating margin was 18.7% against a 19.5% plan; with operating expenses on plan at 45.5% of revenue, the entire gap came from gross margin.
-
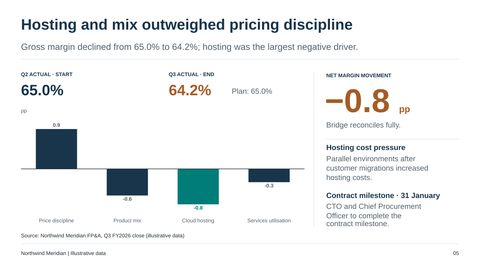
5Hosting and mix outweighed pricing discipline
Speaker notes
Within gross margin, hosting was the largest negative driver, but it was not the only pressure. Pricing discipline added 0.9 points, while the greater services mix cost 0.6 points, hosting cost 0.8 points, and services utilization cost another 0.3 points. Together, those movements reconcile the decline from 65.0% in Q2 to 64.2% in Q3, also 0.8 points below plan. The hosting issue is tied to parallel environments following migration, so completing the customer moves alone was not enough; decommissioning and the contract work must follow.
-
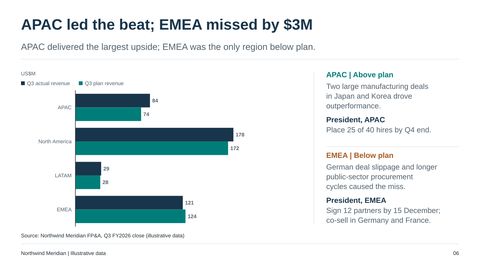
6APAC led the beat; EMEA missed by $3M
Speaker notes
Turning from the cost drivers to where growth came from, regional performance was uneven. APAC delivered $84 million against a $74 million plan, the largest positive variance, driven by two manufacturing deals in Japan and Korea. EMEA delivered $121 million against $124 million, with German deal slippage and longer public-sector procurement cycles causing the shortfall. The response is therefore different by region: add capacity to support APAC demand, while building partner co-selling coverage in Germany and France.
-
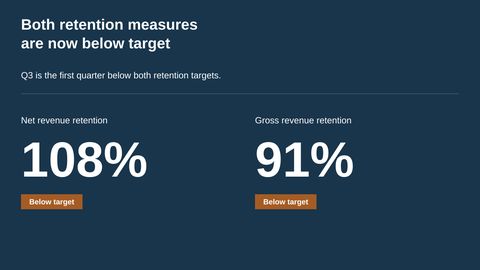
7Both retention measures are now below target
Speaker notes
Beyond those regional differences, retention is a separate operating weakness that the revenue beat must not obscure. Q3 was the first quarter in this period with both measures below target, so we need to address both expansion performance and losses within the existing customer base.
-
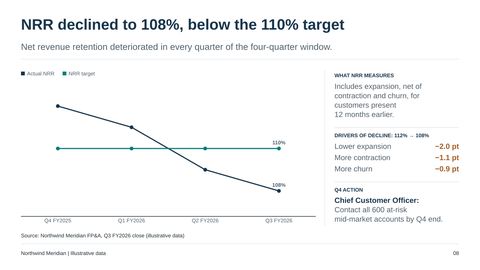
8NRR declined to 108%, below the 110% target
Speaker notes
Looking first at retention including expansion, NRR declined every quarter from 112% to 108%, versus a 110% target. This measure follows customers who were with us 12 months earlier, capturing expansion as well as contraction and churn. Half of the four-point decline came from lower expansion, specifically fewer mid-market upsells; the other half came from increased contraction and churn. That means the issue is broader than customer departures alone, and the Chief Customer Officer’s Q4 action is to contact all 600 at-risk mid-market accounts.
-
9GRR fell to 91%, below the 92% target
Speaker notes
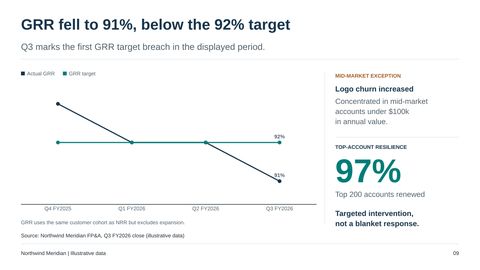
Excluding expansion confirms that the deterioration is not just an upsell issue. GRR fell from 93% to 91% across the period, breaching the 92% target for the first time in Q3. Logo churn rose to 1.9% from 1.6% in Q2 and was concentrated in mid-market accounts with annual value under $100,000. By contrast, the top 200 accounts, representing 58% of subscription revenue, renewed at 97%, supporting a targeted intervention rather than a blanket response.
-
10Low adoption is the churn reason we can address directly
Speaker notes
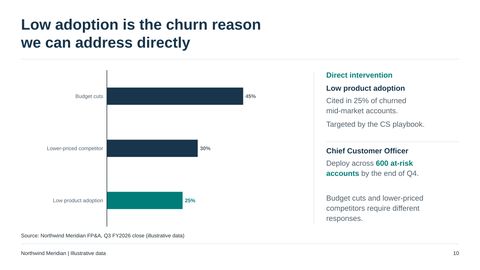
That concentration tells us where to intervene, while exit interviews help define what the intervention can realistically address. Low adoption was cited by 25% of churned mid-market accounts, compared with 45% citing budget cuts and 30% citing lower-priced competitors. The customer-success playbook directly targets adoption across the 600 at-risk accounts by Q4 end. We should not treat it as a solution to every churn cause; budget pressure and competitive pricing require different responses.
-
11Our Q4 forecast is below the $428M plan
Speaker notes
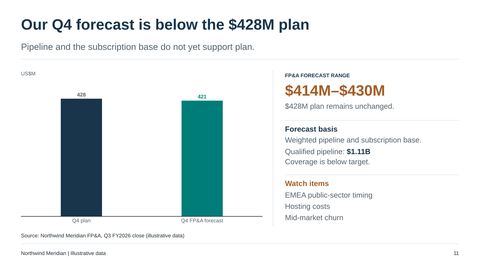
These retention pressures, together with the pipeline position, inform a Q4 forecast that remains below plan. FP&A forecasts $421 million against the unchanged $428 million plan, with a range of $414 million to $430 million. The $1.11 billion qualified pipeline provides 2.6 times coverage against a target of 3.0 times, so the weighted pipeline and subscription base do not yet support plan. About $9 million of pipeline is exposed to EMEA public-sector timing, while mid-market churn remains a revenue risk and hosting costs remain a margin risk.
-
12Each material gap has an owner and a milestone
Speaker notes
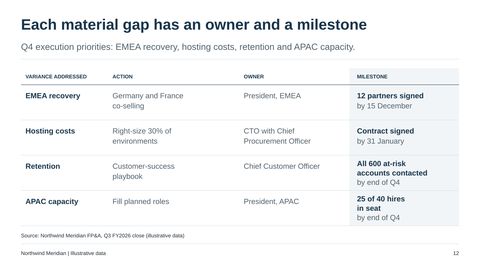
Against that outlook, execution needs to be tied to named owners and measurable milestones. The President of EMEA owns signing 12 partners by December 15 to support co-selling in Germany and France. The CTO and Chief Procurement Officer own the hosting program, including right-sizing 30% of environments and signing the contract by January 31. The Chief Customer Officer owns contacting all 600 at-risk accounts by Q4 end, while the President of APAC owns placing 25 of the planned 40 hires by the same point. These milestones let us distinguish progress on the actions from the financial outcomes we still need to deliver.
-
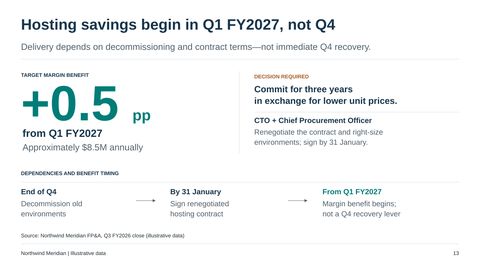
13Hosting savings begin in Q1 FY2027, not Q4
Speaker notes
One timing distinction is especially important within that execution plan: hosting is not a Q4 margin recovery lever. The targeted benefit is 0.5 percentage points of margin, approximately $8.5 million annually, beginning in Q1 FY2027. It depends on decommissioning old environments by Q4 end and signing the renegotiated contract by January 31. The decision is whether to accept a three-year commitment in exchange for lower unit prices, with the CTO and Chief Procurement Officer accountable for delivery.
-
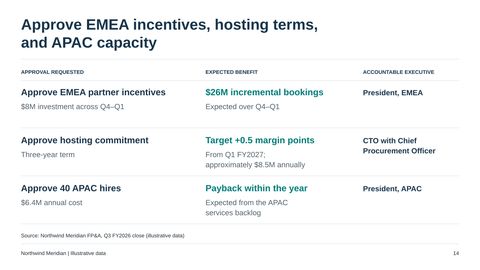
14Approve EMEA incentives, hosting terms, and APAC capacity
Speaker notes
With that benefit timing clear, we’re asking for three targeted approvals. First, approve $8 million of EMEA partner incentives across Q4 and Q1, with expected incremental bookings of $26 million over that period under the President of EMEA. Second, approve the three-year hosting commitment, targeting the margin benefit from Q1 FY2027 under the CTO and Chief Procurement Officer. Third, approve 40 APAC hires at an annual fully loaded cost of $6.4 million, with payback expected within the year from the services backlog under the President of APAC. These decisions support recovery and capacity where the evidence points, while the owned milestones keep us accountable for execution rather than assuming the Q3 revenue beat has resolved the operating gaps.


What you can change in the file
Every word is real text
Titles, bullets and labels are text boxes. Retype them, restyle them or translate them.
Diagrams are shapes
Boxes, arrows and icons are PowerPoint shapes you can move, resize and recolour.
Pictures stay separate
Photos and illustrations are their own images, so you can swap or crop them.
Charts are real charts
Each chart keeps its numbers in its own Excel sheet. Choose Edit Data, type new figures and the chart redraws.
Change the numbers, and the chart follows
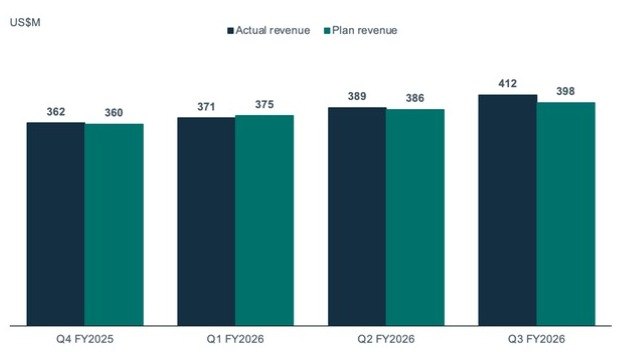
1The native chart in PowerPoint: Q3 actual revenue is 412.
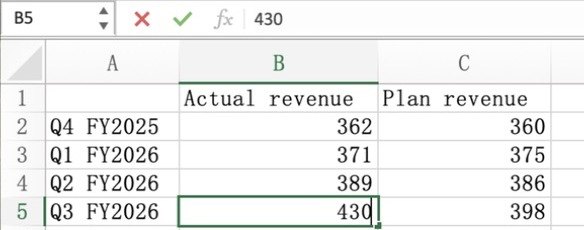
2Chart Design › Edit Data in Excel opens the chart’s own sheet. Type 430 for Q3.
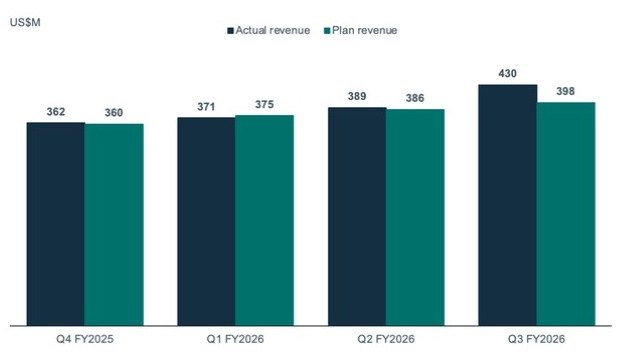
3Back in PowerPoint, the bar and its label have redrawn.
 How to make slides or a PowerPoint automatically
 Luxury hospitality: a flagship hotel investment proposal
 AlphaFold 3: a research briefing for biopharma R&D leaders
Make your next deck in minutes, then make it yours.
Start with 20 free credits. No card needed.
Start free