Data Journalism look for PowerPoint
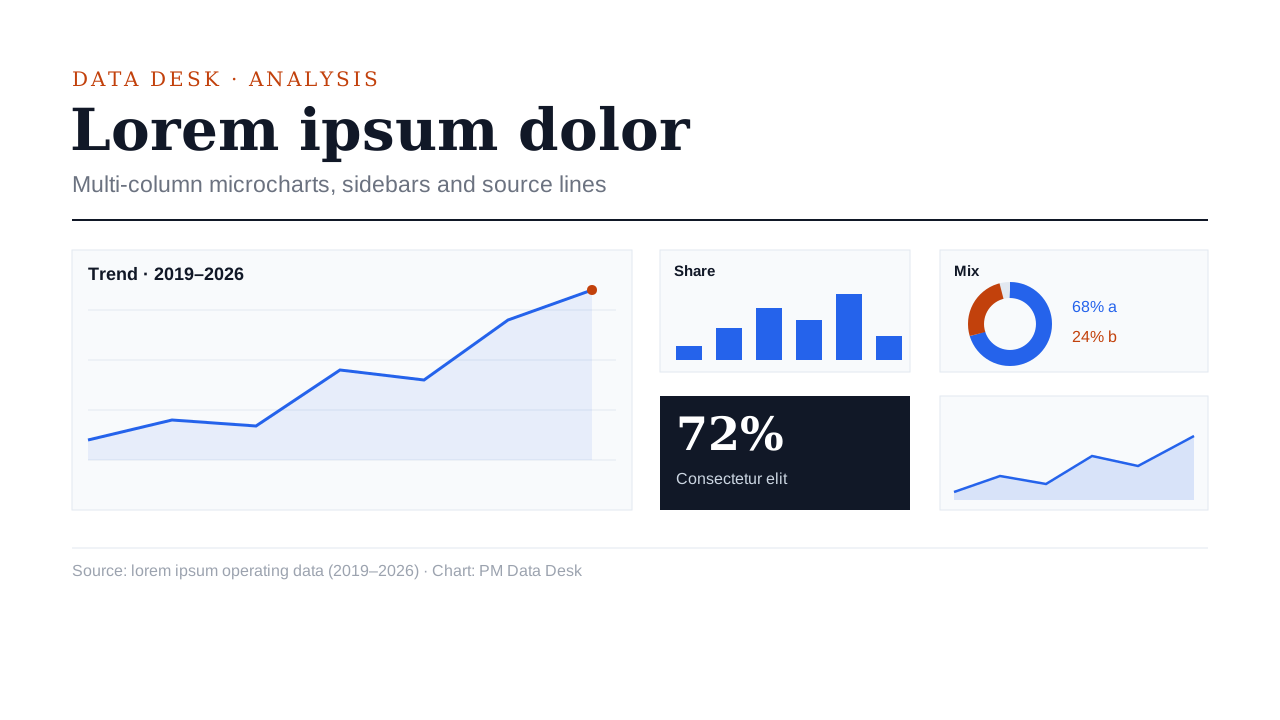
A financial long-read: multi-column grids, micro-charts, tables, sidebars and source lines, with numbers coloured by meaning.
- Results and research findings
- Market and policy analysis
- Thesis defences and data stories
Decks made in this look
Real decks from the gallery. Open one to see every slide or download the .pptx.
 Master's thesis defense: question, method, results and contributions
Questions
When is Data Journalism the right choice?
Market reviews, annual data reports, research and data-driven explainers that put a lot on each slide. For a keynote with one idea per slide, pick a calmer look.
How do charts and tables look in Data Journalism?
Publication-grade: tints of one colour family instead of a rainbow, colour that means up, down, risk or focus, hairline rules, and a source line under the data.
Does Data Journalism use pictures?
Rarely; the charts and tables are the pictures.
Is the deck editable?
Yes. Every slide is native PowerPoint: text boxes, shapes, charts with Edit Data and tables. The look is colours, fonts and layout, so you can change any of it.
 Swiss Minimal
 Soft Rounded
 Glassmorphism
 Dark Tech
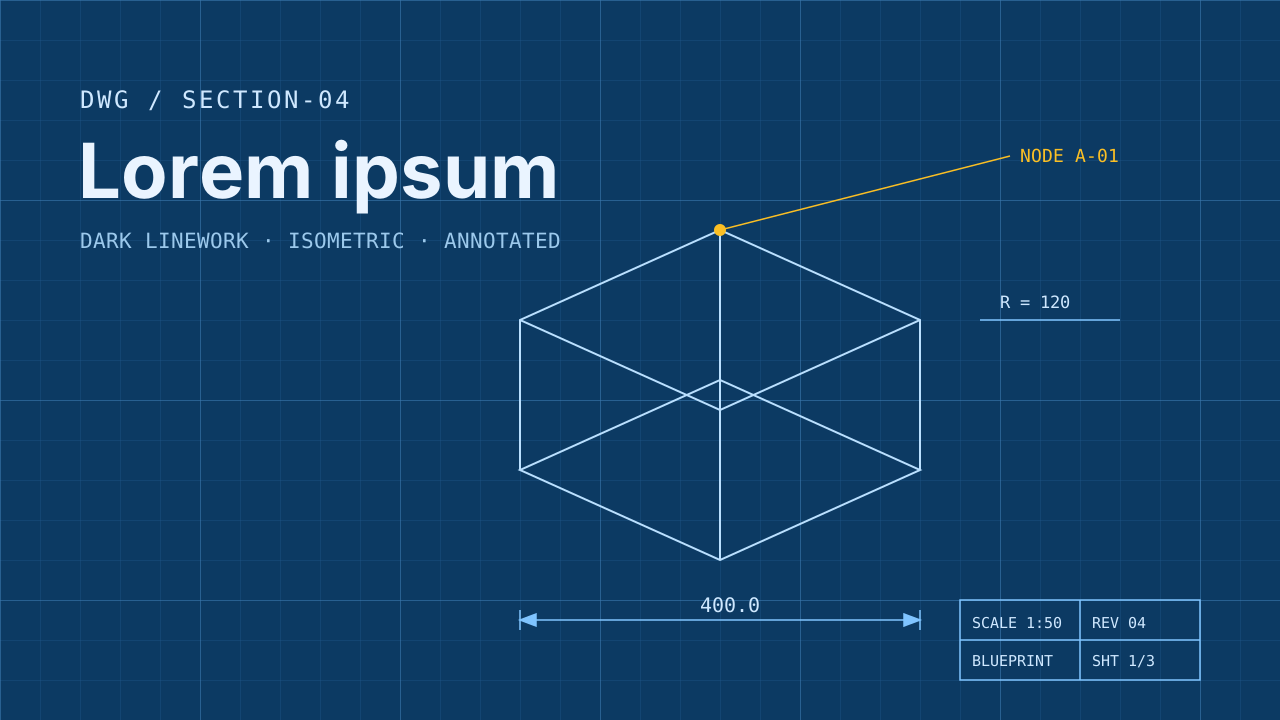 Blueprint
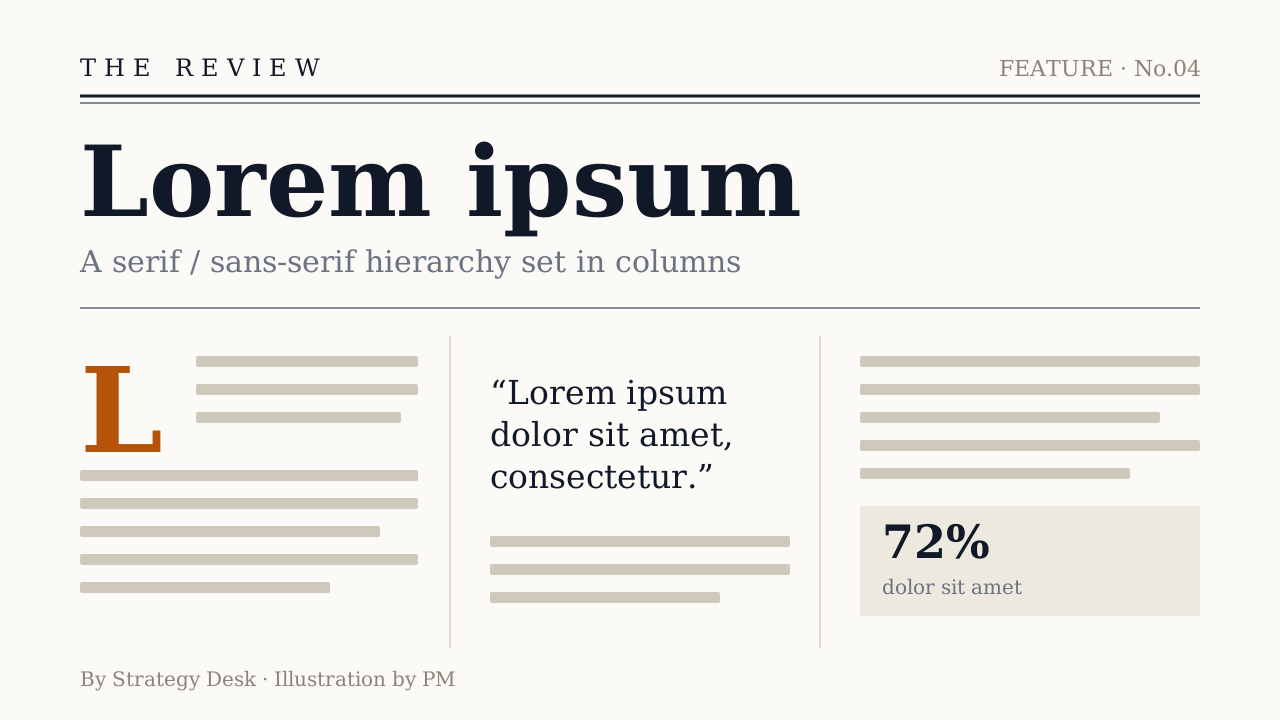 Editorial
 Photo Editorial
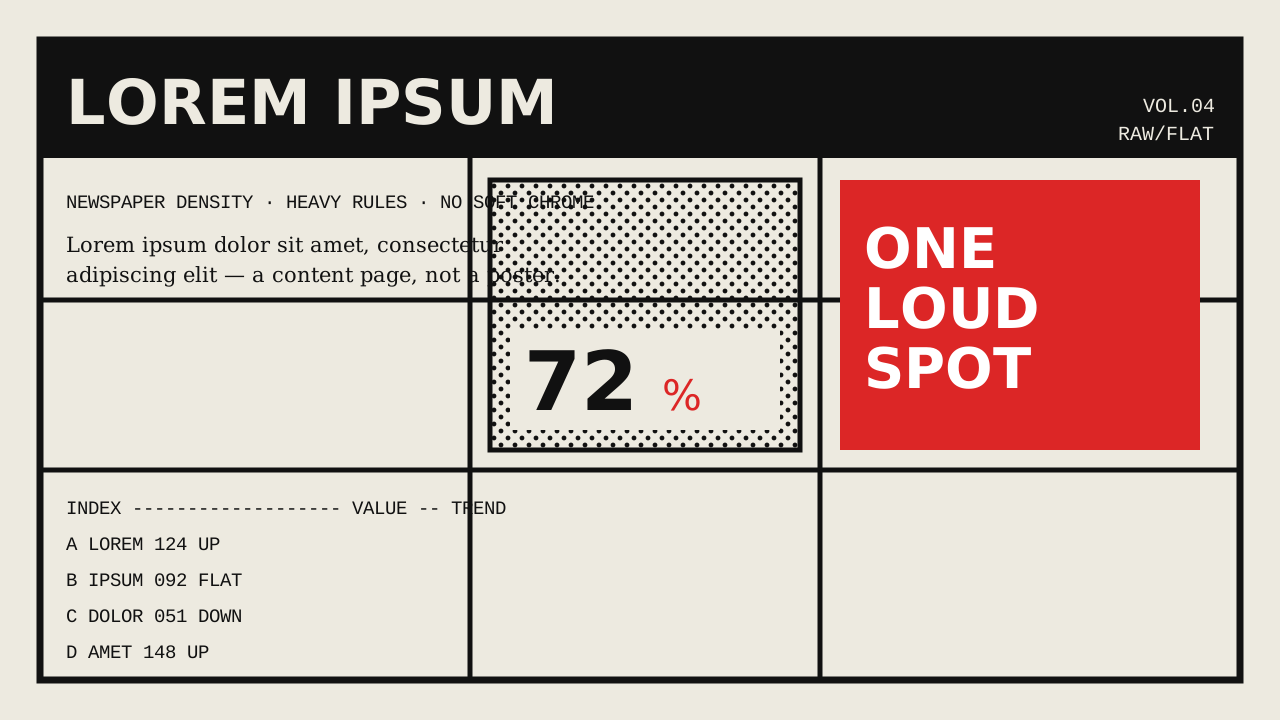 Brutalist
 Memphis
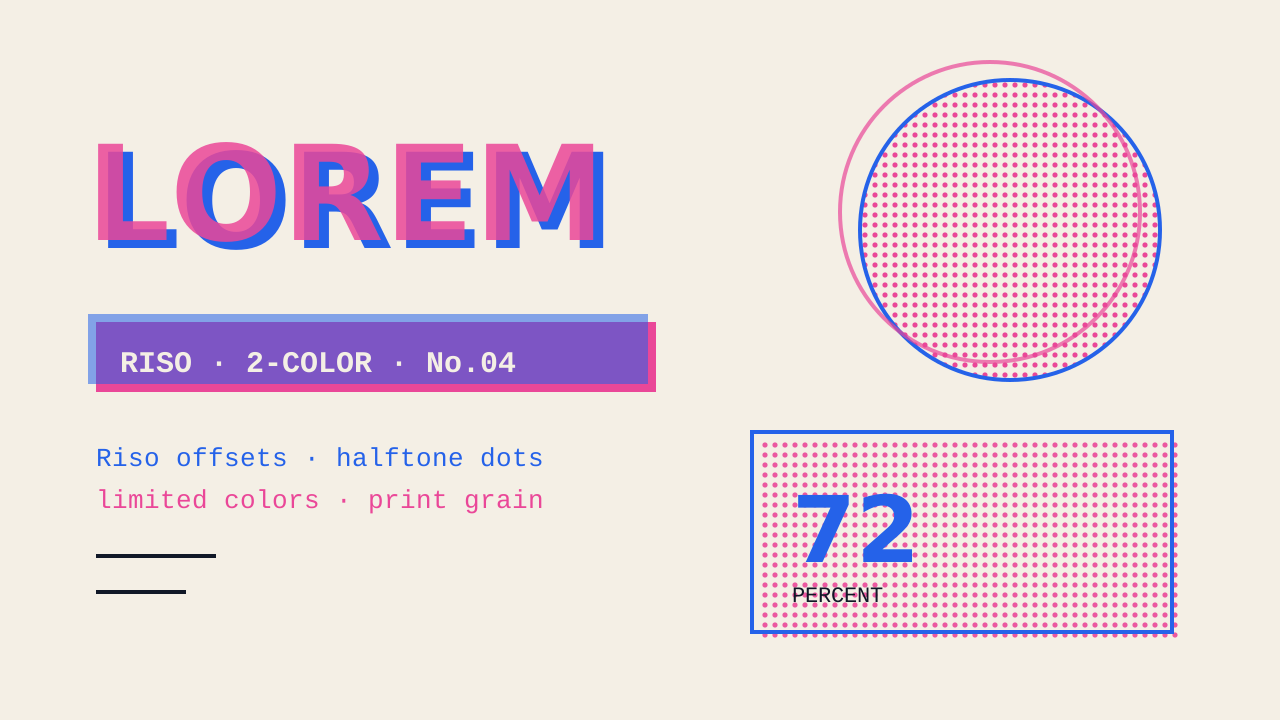 Zine
 Vintage Poster
 Paper Cut
 Sketch Notes
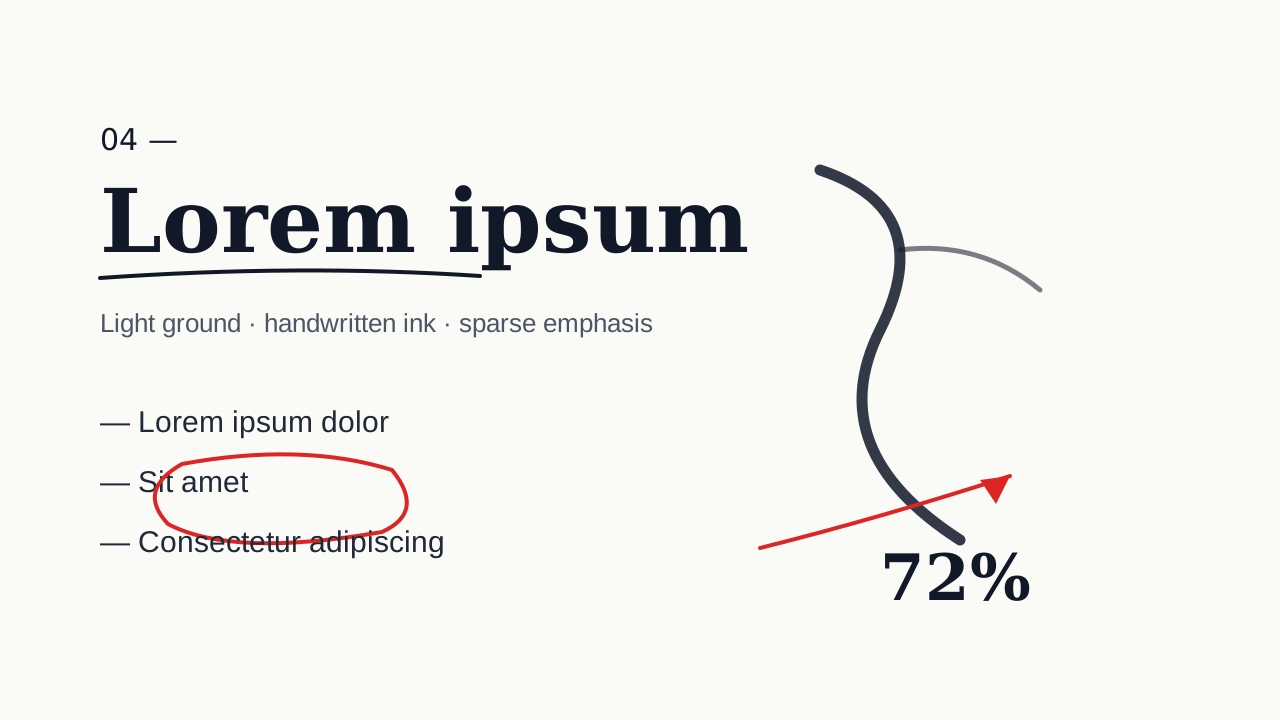 Ink Notes
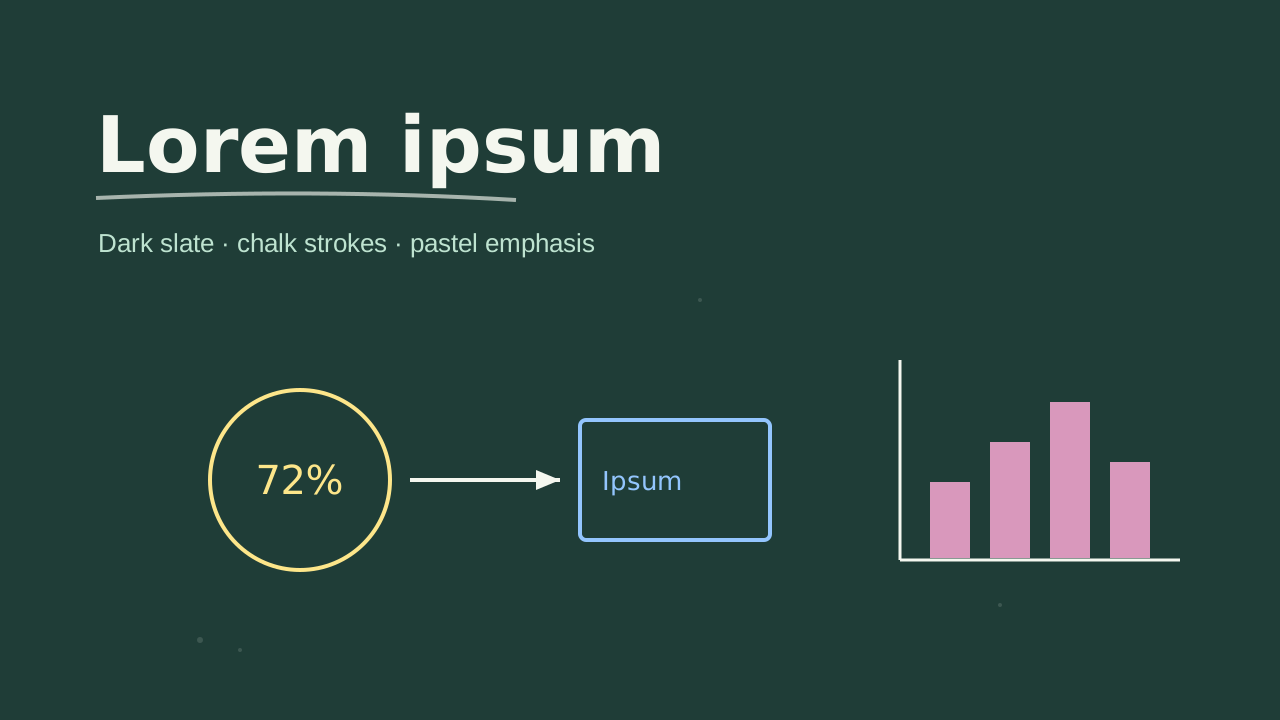 Chalkboard
 Ink Wash
 Pixel Art
Make your next deck in minutes, then make it yours.
Start with 20 free credits. No card needed.
Make a deck in this look