Weekly growth review: funnel, experiments and next actions
A growth team's weekly review, made from a channel and funnel workbook and raw sync notes: acquisition by channel, the conversion funnel, retention and A/B tests as native charts, with every statement labelled Observed, Hypothesis or Proposed. Week 2 was made from week 1's deck plus the new numbers, so you can see last week's hypotheses confirmed or not. Illustrative data.
Week 2: last week's deck, plus this week's workbook (Excel: channels, funnel, retention, experiments) and raw sync notes (Markdown).
With these instructionsThis is the next week's review (W44, Oct 27–Nov 2). The first source is last week's (W43) review as it was presented: keep its slide order, layouts and chart types, and update every number, experiment result, conclusion and action from this week's workbook and notes (the other sources). After the overview, add a 'Since last week' slide: what last week's hypotheses turned into (confirmed, not confirmed, still open), which experiments concluded, and what changed most. Fernway's weekly growth review for W44 (Oct 27–Nov 2), presented by the growth lead to the growth, marketing and operations teams. Turn the workbook and the raw sync notes into a clear review: acquisition by channel (spend, installs, CPI), the conversion funnel, retention, A/B experiment results, and next actions with owners. Use native, editable charts. Clearly separate three kinds of statement and label them: Observed (measured results), Hypothesis (our explanation, not proven) and Proposed (actions we recommend). Use a fixed, reusable weekly structure, the same slide order, layouts and chart types every week, so next week only the data and conclusions change. Write in the presenter's voice. All figures are fictional: label data slides Illustrative data, with source lines 'Source: Fernway analytics and growth sync notes (illustrative)'. Speaker notes should help the presenter tell the week's story: lead with the conclusion, then the cause, the uncertainty and the decision needed; never just repeat the slide text.
Free to download, no sign-in needed. Open it in PowerPoint and change anything.

- Look
- Memphis
- Deck type
- Operating Review
- Images
- No images
- Slides
- 12
- Deck language
- English
Every slide, unedited
Click a slide to see it large.
-
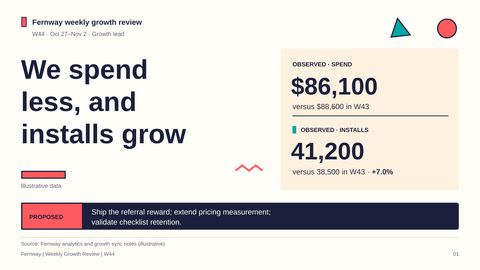
1We spend less, and installs grow
Speaker notes
This week, we reverse last week’s acquisition efficiency problem: we spend less and bring in more installs. In this illustrative W44 review, the recommendation is to ship the referral reward, give pricing more time to measure paid conversion, and validate checklist retention before claiming a downstream benefit. The distinction throughout is between what we observe, what we think explains it, and what the evidence supports doing next.
-
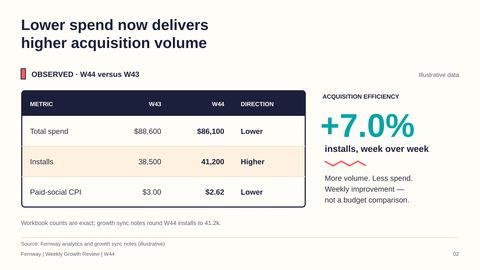
2Lower spend now delivers higher acquisition volume
Speaker notes
Starting with that recovery, installs rise 7.0% to 41,200 while total spend falls from $88,600 to $86,100. Paid-social CPI also improves from $3.00 to $2.62, so the acquisition gain is not simply the result of buying more volume. These are week-over-week improvements, not results against a budget target. We use the workbook’s exact counts; the sync notes’ 41.2k is the same W44 result rounded.
-
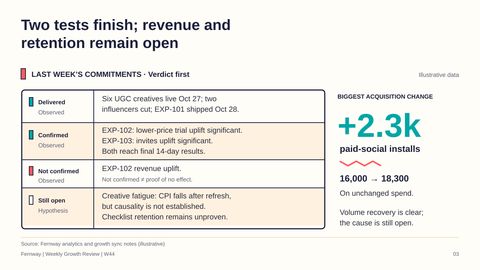
3Two tests finish; revenue and retention remain open
Speaker notes
Behind those totals, last week’s commitments turn into concrete delivery, but only some hypotheses become confirmed results. The six new creatives go live, two underdelivering influencers are cut, and the checklist ships on October 28. The pricing and referral tests reach final 14-day results with significant lifts in trial starts and invites, respectively, but pricing does not establish a revenue win—and that is not proof of no revenue effect. Paid social makes the biggest acquisition move, adding 2,300 installs without more spend, while creative fatigue and checklist retention remain open explanations or outcomes.
-
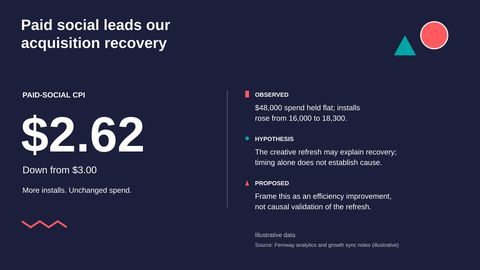
4Paid social leads our acquisition recovery
Speaker notes
That paid-social gain is the center of the acquisition recovery: the same $48,000 now delivers 18,300 installs rather than 16,000. We can call that an efficiency improvement; we cannot yet say the creative refresh causes it.
-
5Social adds volume while influencer spend falls
Speaker notes
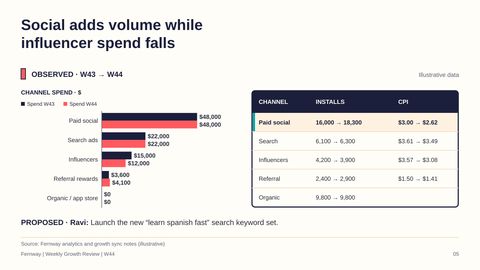
Looking across the other channels helps separate where we gain volume from where we save money. Paid-social spending stays at $48,000, while influencer spending falls from $15,000 to $12,000 and influencer installs decline from 4,200 to 3,900. Referral spending rises from $3,600 to $4,100, but installs increase from 2,400 to 2,900 and CPI improves to $1.41. Search adds modest volume at unchanged spend and organic stays flat; Ravi’s proposed next step is the new “learn spanish fast” keyword set.
-
6Social CPI falls after the creative refresh
Speaker notes
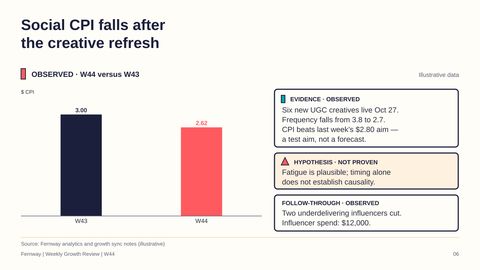
Returning to the largest gain, the creative refresh gives us a plausible explanation for social’s recovery, not a proven one. After six new UGC creatives go live on October 27, frequency falls from 3.8 to 2.7 and CPI falls from $3.00 to $2.62. That clears last week’s $2.80 aim, which was a target rather than a forecast. The timing is consistent with the fatigue hypothesis, but we should report the measured improvement without treating the coincidence as causal evidence.
-
7The checklist ships; activation reaches 66.1%
Speaker notes
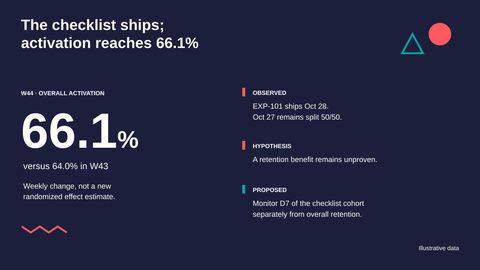
Beyond acquisition, the checklist rollout is now complete, backed by last week’s randomized activation result of 67.2% versus 60.8%. This week’s overall activation reaches 66.1%, but that weekly rate is not a new treatment-effect estimate, and retention still needs its own readout.
-
8Trial starts reach 29% of activated users
Speaker notes
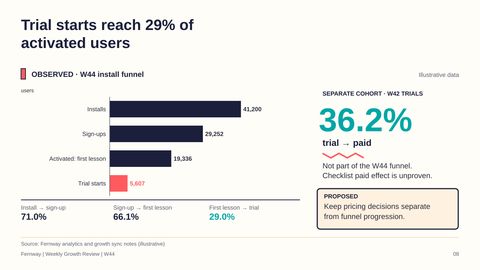
Following those users further through the funnel, we reach 5,607 trial starts out of 19,336 users who complete a first lesson, a 29.0% conversion rate. Those users sit within the W44 funnel of 41,200 installs and 29,252 sign-ups. The separate 36.2% trial-to-paid figure belongs to W42 trials, so we cannot append it to this funnel or use it to claim that the newly shipped checklist improves paid conversion. We need to keep the weekly funnel, older-cohort paid conversion, and pricing experiment results distinct.
-
9D7 reaches 25%, but its cohort label needs reconciliation
Speaker notes
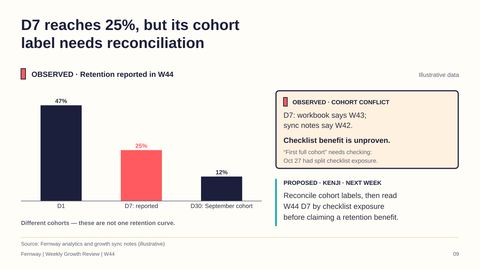
That same cohort discipline matters even more for retention, where the reported D7 rate is 25% but the underlying label conflicts. The workbook calls it the previous week’s cohort, meaning W43, while the sync notes call it W42; until that is reconciled, we cannot make a clean cohort comparison. D1 at 47% and September-cohort D30 at 12% also belong to different windows, not one retention curve. Kenji’s proposed next step is to resolve the labels and read W44 D7 by checklist exposure, since October 27 still has a 50/50 split.
-
10EXP-101 moves from rollout to retention monitoring
Speaker notes
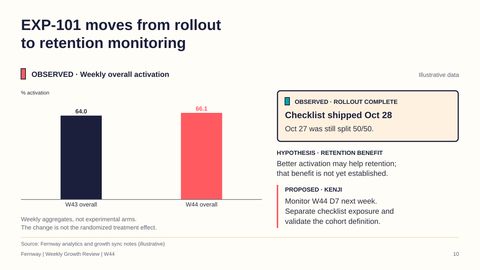
Once we resolve that cohort definition, the checklist’s next evidence obligation is retention, not another declaration that activation wins. Overall activation moves from 64.0% to 66.1%, but these are weekly totals rather than randomized experimental arms. The October 28 rollout closes the delivery commitment; it does not close the hypothesis that better activation improves retention. For next week, I recommend that Kenji validate the cohort and separate checklist exposure before drawing a D7 conclusion.
-
11Referral earns rollout; pricing needs paid-conversion data
Speaker notes
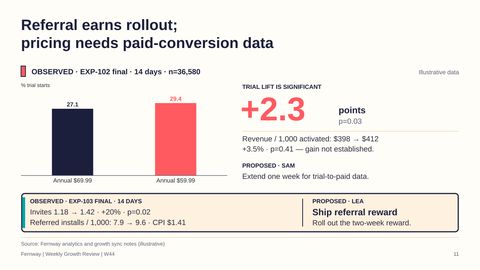
With checklist retention still open, the two completed tests point to different decisions. In the pricing test’s final 14-day sample of 36,580, the $59.99 annual offer lifts trial starts to 29.4% from 27.1% at $69.99, with p=0.03. Revenue per 1,000 activated users rises from $398 to $412, but p=0.41 does not establish a revenue win, so I recommend that Sam extend measurement one week for trial-to-paid data. Referral has a clearer rollout case: invites rise from 1.18 to 1.42 with p=0.02, and referred installs rise from 7.9 to 9.6 per 1,000 users at $1.41 per install. I recommend that Lea ship the two-week reward.
-
12Let's ship referral and close the revenue and retention questions
Speaker notes
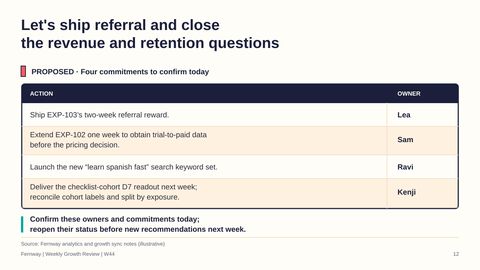
Those different evidence standards leave us with four proposed commitments to confirm today. Lea ships the two-week referral reward, Sam extends pricing measurement for one week before a pricing decision, and Ravi launches the new search keyword set. Kenji delivers the checklist-cohort D7 readout next week, after reconciling labels and separating exposure. We finish the week with better acquisition efficiency and a shipped checklist; let’s carry that progress forward without turning unresolved revenue and retention signals into claims, and revisit these commitments before making new recommendations next week.


What you can change in the file
Every word is real text
Titles, bullets and labels are text boxes. Retype them, restyle them or translate them.
Diagrams are shapes
Boxes, arrows and icons are PowerPoint shapes you can move, resize and recolour.
Pictures stay separate
Photos and illustrations are their own images, so you can swap or crop them.
Charts are real charts
Each chart keeps its numbers in its own Excel sheet. Choose Edit Data, type new figures and the chart redraws.
Week 43 → Week 44: what changed, what stayed
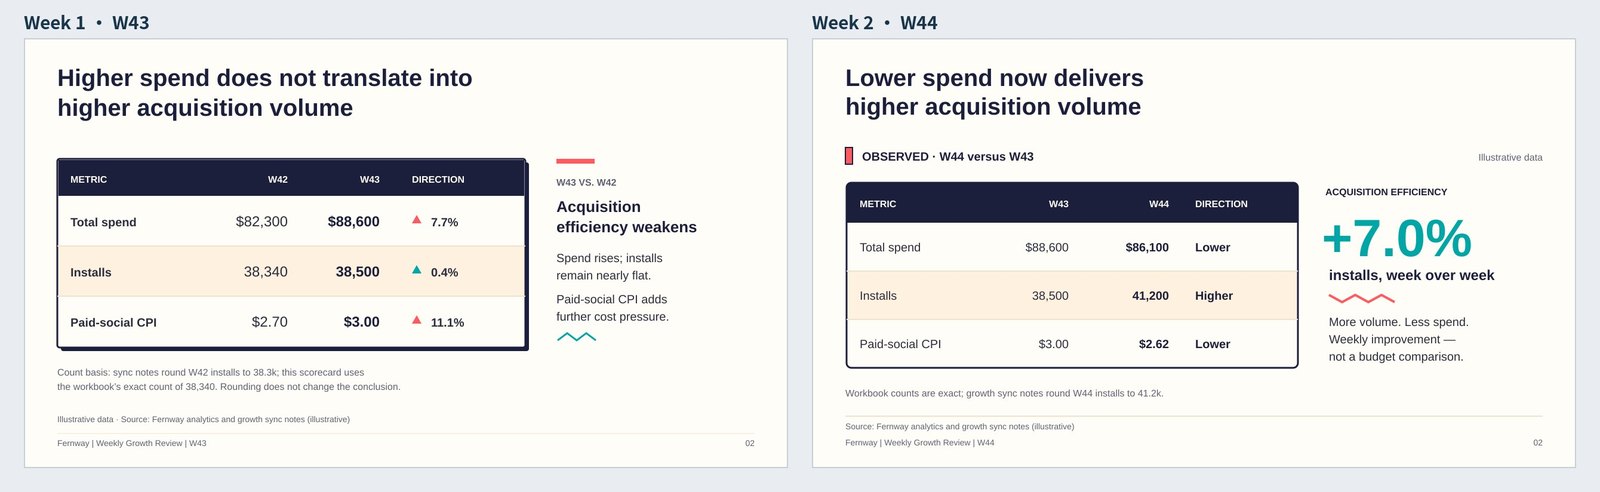
1The scorecard: same layout, this week's numbers.
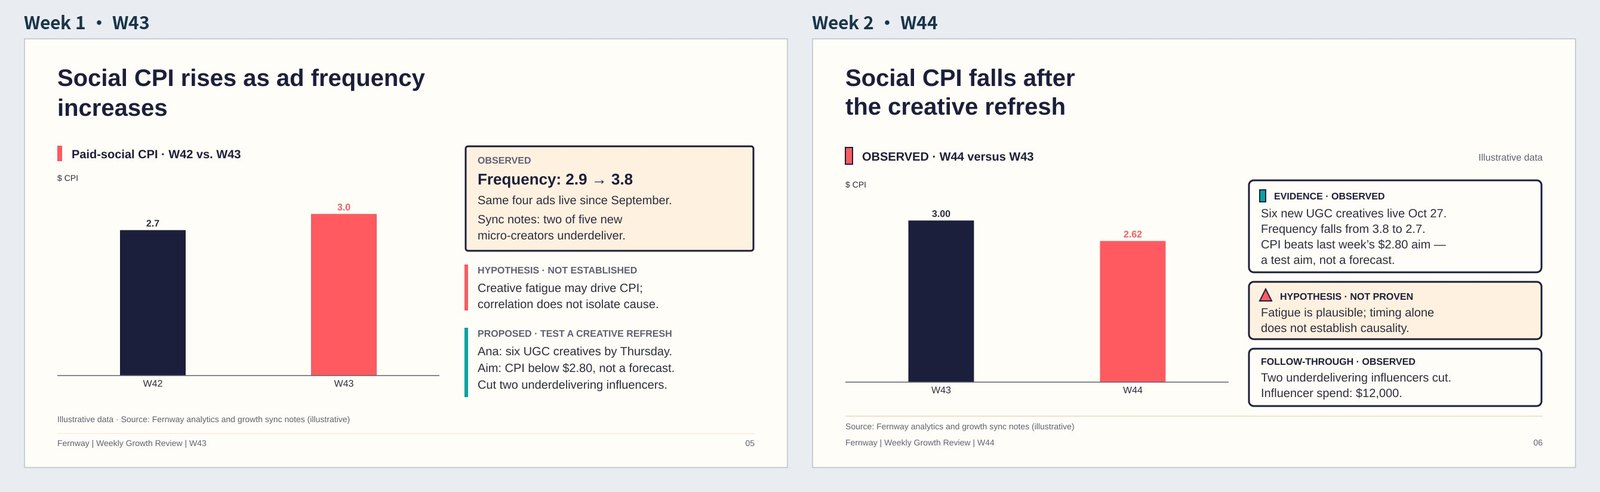
2Paid-social CPI: week 1's hypothesis, checked against week 2's result.
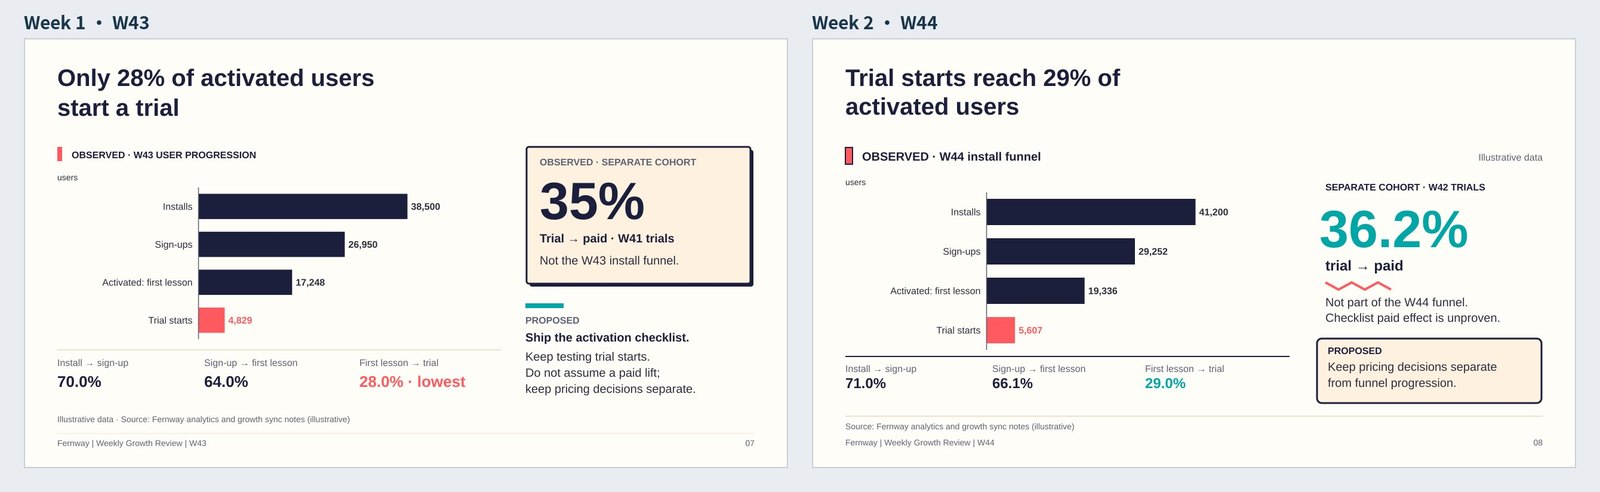
3The funnel: the same chart, the new week's users.
 How to make slides or a PowerPoint automatically
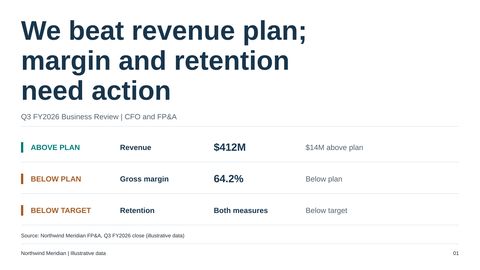 Quarterly business review: performance, drivers and decisions
 Luxury hospitality: a flagship hotel investment proposal
Make your next deck in minutes, then make it yours.
Start with 20 free credits. No card needed.
Start free