Community print fair: recap and plan
A warm recap for volunteers, stallholders and sponsors, made from rough debrief notes and a workbook: three years of growth, where every pound came from and went, survey results as native charts, an honest slide on the 55-minute load-in queue, and the agreed plan for 2027. One stock photo, captioned as not from the fair, and two screen-print illustrations. Fictional event and data.
Organisers' debrief notes (Markdown) and a numbers workbook (Excel: money, growth, workshops, surveys, 2027 plan). Fictional event and figures.
With these instructionsThe Riverside Print Fair 2026 recap, presented by the Inkhouse Collective organisers at the volunteers' and stallholders' evening on 9 December 2026; the same deck goes to sponsors. Write in the organisers' warm, plain voice. Cover the fair in numbers, three years of growth, the money (where every pound came from and went), what visitors and stallholders told us, what went well, what went wrong, the agreed plan for 2027, and the thank-yous. Show growth, money and survey results as native, editable charts. Use photographs of printmaking, risograph prints, zines and print fairs as atmosphere only: they are not photos of our fair, so captions must never claim they are. All names and figures are fictional: label data slides Illustrative data, with source lines 'Source: Inkhouse Collective fair records and surveys, September 2026 (illustrative)'. Speaker notes should sound like an organiser talking to volunteers: thank people by name where the notes give names, and be honest about the load-in queue.
Free to download, no sign-in needed. Open it in PowerPoint and change anything.

- Look
- Zine
- Deck type
- Narrative Keynote
- Images
- Photos and AI illustrations
- Slides
- 12
- Deck language
- English
Every slide, unedited
Click a slide to see it large.
-
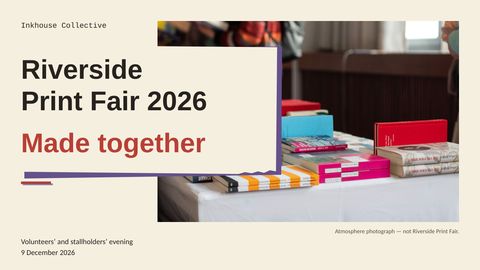
1Riverside Print Fair 2026 Made together
Speaker notes
Welcome, and thank you for being here to look back at the fair we made together. Tonight is a celebration of the work that went into it, but also an honest account of what we need to do better. For everyone here, and for sponsors reading this afterward, the names and figures in this recap are illustrative.
-
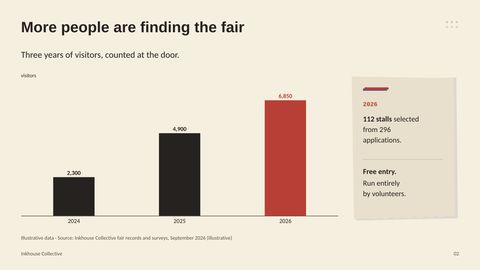
2More people are finding the fair
Speaker notes
Let’s start with how many people that shared effort brought through the doors. We counted 6,850 visitors this year, compared with 4,900 last year and 2,300 in 2024, so the growth has continued across all three years. Stalls have grown too, from 46 to 84 to 112, with 296 applications this year. That is strong demand for a free-entry fair run entirely by volunteers, but attendance alone does not tell us how well it worked for people.
-
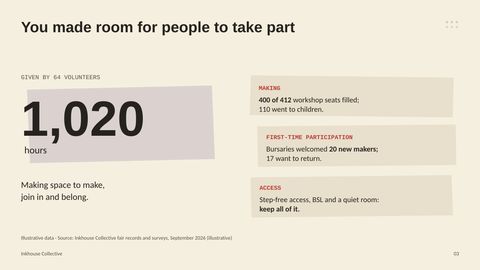
3You made room for people to take part
Speaker notes
What matters alongside those visitor numbers is whether people could actually join in. Our 64 volunteers gave 1,020 hours, supporting a fair where 400 of 412 workshop places were filled, including 110 places for children. The £150 bursaries helped 20 first-time stallholders who could not afford the fee, and 17 say they want to return. Step-free access, BSL interpretation at the opening and four workshops, and a quiet room used by about 150 visitors were part of that welcome, and we want to keep all of them. The new map and stall numbers also helped, with far fewer people needing to ask the information desk where things were.
-
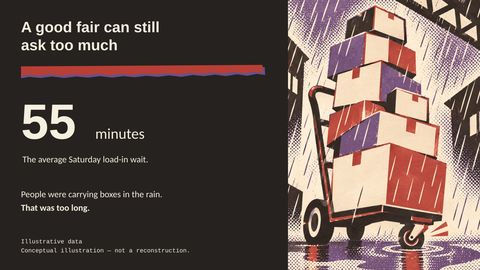
4A good fair can still ask too much
Speaker notes
But that welcome did not extend far enough to the people arriving to set up. The Saturday load-in wait averaged 55 minutes, with people carrying boxes in the rain, and we need to say plainly that this was unacceptable.
-
5People want to return—and want practical fixes
Speaker notes
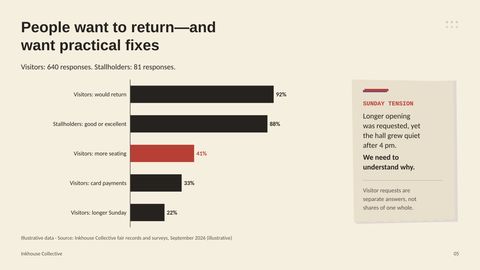
That difficult arrival belongs in the same account as the positive feedback, not hidden behind it. Among 640 visitor responses, 92% said they would return, while 88% of 81 stallholder respondents rated the fair good or excellent. Seating was the most common visitor request at 41%, ahead of card payments at 33% and longer Sunday opening at 22%; these were separate answers, not parts of a single total. The request for longer hours needs more investigation because the hall was quiet after 4 pm on Sunday, and we do not yet know why. Stallholders also reported dim lighting in Hall B and asked to borrow card readers, and we ran out of tote bags by 1 pm on Saturday.
-
6Four income streams brought in £18,950
Speaker notes
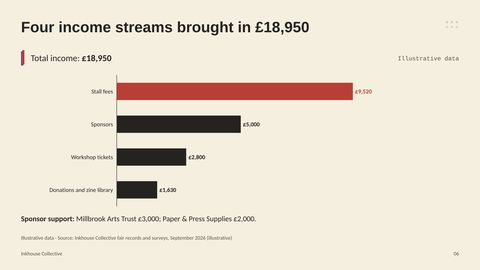
Those requests give us practical priorities, and the money tells us what supported the fair this year. Stall fees were the largest income source at £9,520, compared with £5,000 from sponsorship. Thank you to Millbrook Arts Trust for £3,000 and Paper & Press Supplies for £2,000. Workshop tickets brought in £2,800, and donations and zine-library sales added £1,630, bringing total income to £18,950 while entry remained free.
-
7Every spare pound stays in the fair
Speaker notes
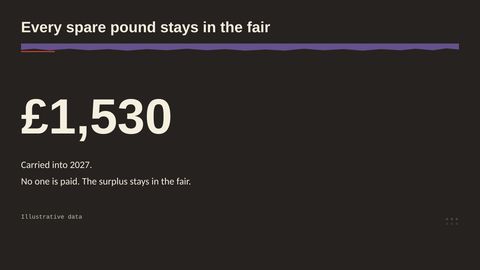
After paying the costs, £1,530 remains to carry into 2027. No one is paid, and that surplus stays in the fair rather than being paid out.
-
8£17,420 paid for the fair to happen
Speaker notes
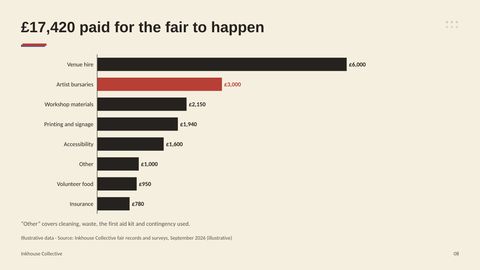
To explain that balance, we also need to account for the £17,420 we spent. Venue hire was the largest cost at £6,000, covering three days including setup, while £3,000 funded the 20 artist bursaries. Workshop materials cost £2,150, and printing and signage—including maps, stall numbers, posters and tote bags—cost £1,940. Accessibility accounted for £1,600, volunteer food for £950 and insurance for £780. The remaining £1,000 covered cleaning, waste, the first aid kit and contingency actually used, so the total includes both the practical running costs and support for participation.
-
9Next year starts with a better arrival
Speaker notes
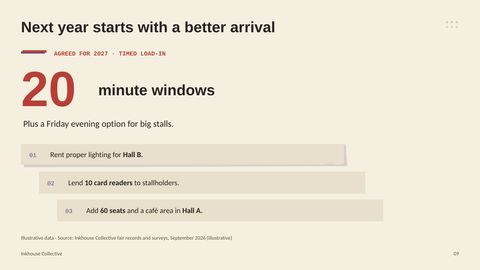
With that spending accounted for, our next job is to address the problems people raised. We have agreed timed load-in slots in 20-minute windows, plus a Friday evening option for big stalls; those are arrival windows, not a promise that every setup will take 20 minutes. We will rent proper lighting for Hall B and provide a lending pool of 10 card readers. Another 60 seats and a café area in Hall A respond directly to the most common visitor request. These are practical changes to how the fair works, rather than simply an expansion.
-
10Better to take part in—not just bigger
Speaker notes
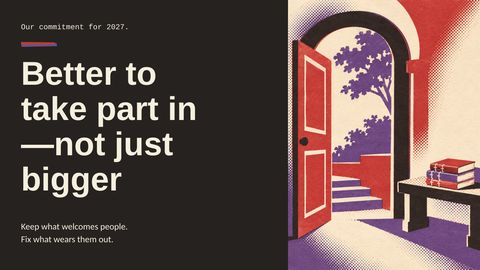
That is the principle behind the whole plan for next year: make participation easier before chasing more growth. We want to protect what welcomed people and fix the things that made taking part unnecessarily hard.
-
11The plan needs more backing, not more crowding
Speaker notes
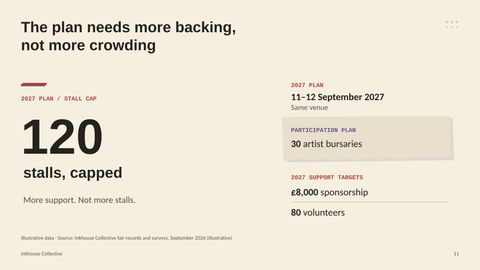
Putting that principle into practice means asking for more support without trying to pack more and more into the depot. We plan to return to the same venue on September 11 and 12, 2027, with a firm cap of 120 stalls, compared with 112 this year, because the depot is full. We want to increase bursaries from 20 to 30 and volunteer numbers from 64 to 80. The sponsorship target rises from £5,000 to £8,000 to help pay for the agreed improvements. For sponsors, that is the purpose of the extra backing: better participation and delivery, not crowding for its own sake.
-
12Help us make the next fair easier to join
Speaker notes
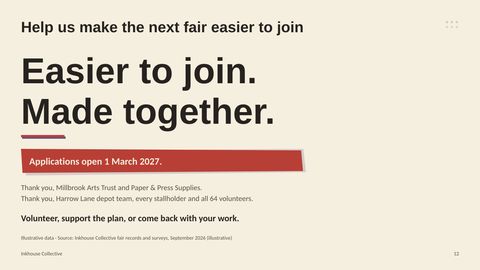
That extra backing will come from the same shared effort that made this fair possible. Thank you to Millbrook Arts Trust, Paper & Press Supplies, the Harrow Lane depot team, every stallholder and all 64 volunteers. Applications open on March 1, 2027, and we would love you to come back with your work, volunteer or support the plan. We made a thriving fair together; now let’s make the next one easier to join.


What you can change in the file
Every word is real text
Titles, bullets and labels are text boxes. Retype them, restyle them or translate them.
Diagrams are shapes
Boxes, arrows and icons are PowerPoint shapes you can move, resize and recolour.
Pictures stay separate
Photos and illustrations are their own images, so you can swap or crop them.
Charts are real charts
Each chart keeps its numbers in its own Excel sheet. Choose Edit Data, type new figures and the chart redraws.
 How to make slides or a PowerPoint automatically
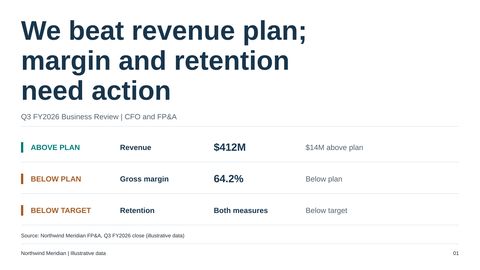 Quarterly business review: performance, drivers and decisions
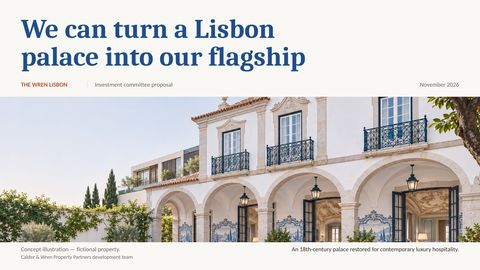 Luxury hospitality: a flagship hotel investment proposal
Make your next deck in minutes, then make it yours.
Start with 20 free credits. No card needed.
Start free