校园可持续发展:调查结果与行动方案
根据一份简短的项目报告和调查数据表制作的学生小组汇报:出行、一次性杯子和垃圾分类的原生图表,五项行动的对比,诚实的局限说明,参考文献,以及按四位汇报人分配、带交接语的演讲者备注。精致,但仍是学生作业的样子。虚构调查数据。
一份两页的小组项目报告(Word)和调查结果(Excel,412 份虚构问卷)。
以及这些说明A university group presentation for the ENV 210 module at Halden University, given by Group 4 (Maya, Daniel, Priya and Tomás) to their lecturer and classmates. Build it from the short project report and the survey workbook: why we did it, how we surveyed (and the limits of the sample), findings on travel, cups and recycling, support for proposed actions, a comparison of the five actions (cost, carbon saving, support, time to start), our recommendations, limits and next steps, and a references slide. Show survey results as native, editable charts and the comparison as an editable table. Make it polished but appropriate for students: clear, friendly, not corporate. The university and all data are fictional: label data slides Fictional survey data, with source lines 'Source: ENV 210 Group 4 survey, October 2026 (fictional data)'. Split the speaker notes between the presenters as the report's 'who presents what' section says: start each slide's notes with the presenter's name and a short handover line where the speaker changes.
免费下载,无需登录。用 PowerPoint 打开即可随意修改。

- 风格
- 剪纸
- PPT 类型
- 学术研究
- 图片
- 照片和 AI 插图
- 幻灯片
- 12
- PPT 语言
- English
每一页,未经修改
点击幻灯片查看大图。
-
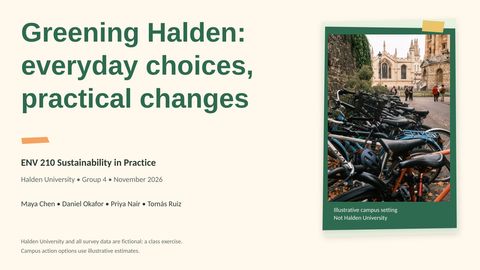
1Greening Halden: everyday choices, practical changes
演讲者备注
Maya: Hi everyone, we’re Group 4, and we’ve been looking at how everyday campus choices could connect to a bigger sustainability goal. This is a class exercise: Halden University, the survey responses, and the campus estimates are fictional. We’ll explain what the evidence suggests we should try, and where it is too limited to promise results.
-
2Our question is which practical changes students would support
演讲者备注
Maya: To turn that broad goal into something practical, we focused on travel, cup use, and recycling. Our question was which relatively low-cost changes respondents would support, and how those changes could contribute to Halden’s fictional net-zero ambition for 2035.
-
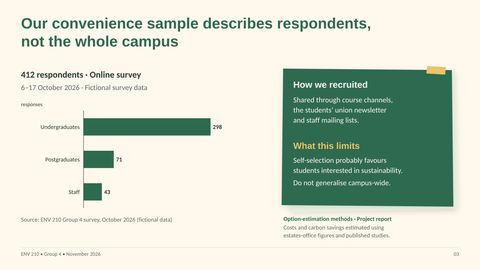
3Our convenience sample describes respondents, not the whole campus
演讲者备注
Maya: To answer that question, we ran an online survey from October 6 through 17, using course channels, the students’ union newsletter, and staff mailing lists. Of the 412 respondents, 298 were undergraduates, compared with 71 postgraduates and 43 staff, so the responses are heavily weighted toward undergraduate views. Participation was voluntary, and people already interested in sustainability were probably more likely to respond. That means we can describe these respondents, but we cannot treat their preferences as representative of the whole campus. Separately, the project used estates-office figures and published studies to estimate option costs and carbon savings.
-
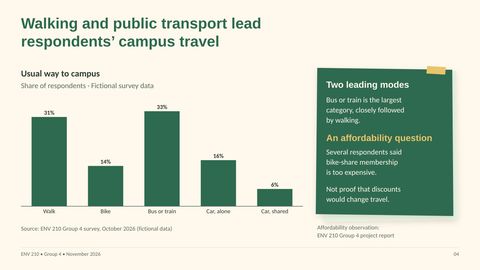
4Walking and public transport lead respondents’ campus travel
演讲者备注
Daniel: Thanks, Maya; keeping those sampling limits in mind, I’ll start with travel. Bus or train was the largest category at 33%, but walking was close behind at 31%, compared with 16% driving alone. Several respondents mentioned expensive bike-share membership, which gives us a possible affordability barrier to investigate. It does not tell us whether a discount would actually change their journeys, so that is a reason to test an intervention rather than assume its impact.
-
5Reusable-cup ownership exceeds daily use
演讲者备注
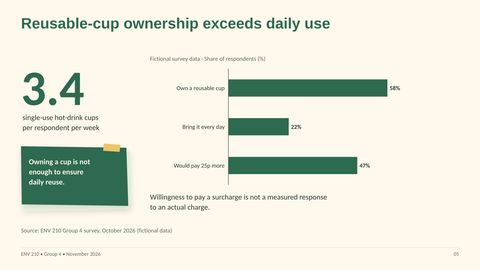
Daniel: That distinction between a possible intervention and actual behavior also matters for cups. While 58% of respondents owned a reusable cup, only 22% brought one every day, alongside an average of 3.4 single-use hot-drink cups per week. Ownership alone clearly does not establish daily reuse, although these results do not explain why people leave their cups behind. The 47% who said they would pay an extra 25p were answering a hypothetical question, not responding to a real charge, so we should not use that figure to predict the effect of pricing.
-
6Unclear labels are the leading reported recycling barrier
演讲者备注
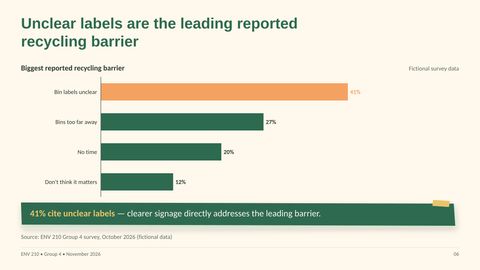
Priya: Thanks, Daniel; recycling gives us a more directly reported practical barrier. Unclear labels were the biggest obstacle for 41% of respondents, compared with 27% who said bins were too far away and 12% who said recycling did not matter. That makes clearer signage a proposal tied to a specific reported problem, rather than simply another appeal to care about sustainability. We would still need to check whether new labels improve recycling behavior.
-
7Refill stations and clearer labels attract the strongest support
演讲者备注
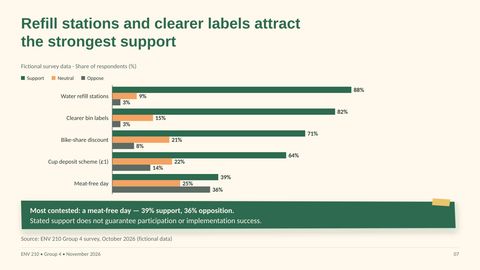
Priya: That match between a reported problem and a proposed solution is reinforced by the support results. Clearer labels attracted 82% support, while refill stations led at 88%; opposition to each was just 3%. Bike-share discounts and the cup deposit scheme also had majority support, at 71% and 64%, respectively. A meat-free day was much more divisive, with 39% supporting it and 36% opposing it. These figures help us judge acceptability, but they are not participation rates or evidence that implementation will succeed.
-
8Choosing an action requires more than popularity
演讲者备注
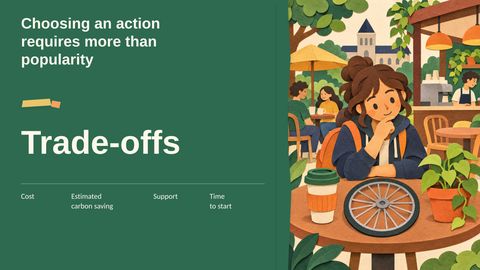
Priya: Those preferences give us one part of the decision, but popularity alone cannot tell us where to start. We also need to weigh first-year cost, estimated annual carbon savings, and time to implementation, while remembering that estimates are not achieved reductions.
-
9The largest estimated carbon saving has the weakest support
演讲者备注
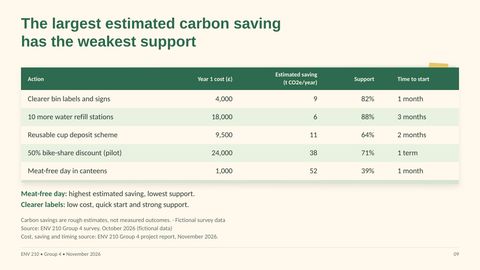
Priya: Bringing those criteria together reveals why there is no clear winner on every measure. The meat-free day has the highest estimated annual saving, at 52 metric tons of carbon dioxide equivalent, and the lowest first-year cost, at £1,000, but only 39% support. Clearer labels offer a different balance: £4,000, an estimated nine metric tons annually, 82% support, and a one-month start time. The bike-share pilot is the most expensive at £24,000, with the second-highest estimated saving of 38 metric tons, while refill stations and the cup scheme have lower estimated savings of six and eleven metric tons. These are rough comparisons to guide a decision, not a forecast we can guarantee.
-
10We recommend three quick wins and a measured bike-share pilot
演讲者备注
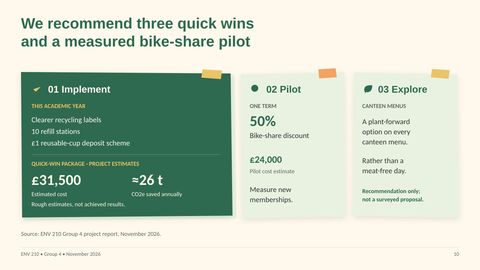
Tomás: Thanks, Priya; those trade-offs are why we recommend a staged package rather than simply choosing the largest carbon estimate. Clearer labels, ten refill stations, and a £1 cup deposit scheme would cost an estimated £31,500 together, with roughly 26 metric tons of annual carbon savings if the project estimates hold. We would separately test a 50% bike-share discount for one term at a cost of £24,000, tracking new memberships without treating membership growth alone as proof of carbon savings. For canteens, we propose exploring a plant-forward option on every menu instead of a meat-free day. That alternative was not surveyed, so we cannot claim respondents endorsed it.
-
11Our evidence combines project data with published reading
演讲者备注
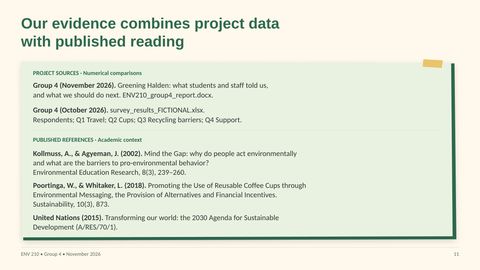
Tomás: To keep those recommendations traceable, it is important to distinguish our numerical sources from our academic context. The fictional workbook supplies the respondent counts and survey percentages, while the project report provides the option estimates and recommendations. The published reading addresses barriers to environmental behavior, reusable-cup interventions, and the broader sustainable-development agenda. It provides context, but it does not turn our fictional survey or rough estimates into demonstrated campus outcomes.
-
12Start practically, then test whether the changes work
演讲者备注
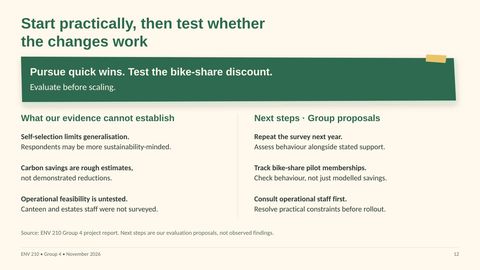
Tomás: With those evidence boundaries in mind, our conclusion is to start practically and evaluate before expanding. We propose repeating the survey next year and assessing behavior alongside stated support, because this self-selected sample may be more sustainability-minded than the wider campus. For bike-share, track new memberships and test actual travel behavior before claiming emissions reductions. We also need to consult canteen and estates staff about practical constraints, since their operational perspectives were not surveyed. Thank you; our central recommendation is a staged plan that treats support as a starting point and results as something we still have to establish.


文件里可以修改什么
每个字都是真实文字
标题、要点和标签都是文本框,可以改写、换样式或翻译。
图示都是形状
方框、箭头和图标都是 PowerPoint 形状,可以移动、缩放和改颜色。
图片各自独立
照片和插画都是单独的图片,可以替换或裁剪。
图表是真正的图表
每个图表的数据都保存在自己的 Excel 表里。选择“编辑数据”,输入新数字,图表就会重新绘制。
 如何自动制作幻灯片或 PowerPoint
 季度经营回顾:业绩、驱动因素与决策
 高端酒店:旗舰物业投资提案